Monday, February 29, 2016

Elliott Wave Stock Market Update - February 29


The market continued its correction today and ended the day testing the Trend Average. There might be more downside ahead but as long as last week's low holds there will be another rally attempt to a higher high. Oil seems to be headed towards $40 and this will continue to help equities rally in the next few weeks.

For further analysis on the NASDAQ, DJI, RUT, Gold, Silver and Oil please visit http://www.ewaveanalytics.com


Short Term Trend = Bullish
Medium Term Trend = Bearish
Long Term Trend = Bearish


* Trends are not trade signals. Trends are posted for situational awareness only and does not take into account wave counts, technical or fundamental conditions of the market. While mechanically trading the posted trends is feasible, keep in mind that these are lagging indicators and as such are prone to whipsaws and I personally do not use nor recommend them to initiate or close positions in the market without taking into consideration other factors.

Friday, February 26, 2016

Elliott Wave Stock Market Update - February 27


The market made a higher high today but started to pullback towards the end of the day ending right at support. We could see the correction continue early next week but as long as 1891 doesn't get breached, the target continues to be in 2000+ territory. I think as long as oil continues towards the $40 level there is a very good chance the market will keep rallying.

Have a great weekend! 

For further analysis on the NASDAQ, DJI, RUT, Gold, Silver and Oil please visit http://www.ewaveanalytics.com


Short Term Trend = Bullish
Medium Term Trend = Bearish
Long Term Trend = Bearish


* Trends are not trade signals. Trends are posted for situational awareness only and does not take into account wave counts, technical or fundamental conditions of the market. While mechanically trading the posted trends is feasible, keep in mind that these are lagging indicators and as such are prone to whipsaws and I personally do not use nor recommend them to initiate or close positions in the market without taking into consideration other factors.

Thursday, February 25, 2016

Elliott Wave Stock Market Update - February 25


The market continued its rally today and was able to break resistance and re-capture its 50 DMA. This is a positive sign for the bullish case as continued trade over 1947 will lead to a challenge to the 200 DMA (currently at 2027). To confirm the market is in a bullish W3, we need to see strong buying in the next few sessions.

For further analysis on the NASDAQ, DJI, RUT, Gold, Silver and Oil please visit http://www.ewaveanalytics.com


Short Term Trend = Bullish
Medium Term Trend = Bearish
Long Term Trend = Bearish


* Trends are not trade signals. Trends are posted for situational awareness only and does not take into account wave counts, technical or fundamental conditions of the market. While mechanically trading the posted trends is feasible, keep in mind that these are lagging indicators and as such are prone to whipsaws and I personally do not use nor recommend them to initiate or close positions in the market without taking into consideration other factors.

Wednesday, February 24, 2016

Elliott Wave Stock Market Update - February 24


As stated a few days ago "If the count posted is correct, we will see a correction of the entire rally in the next few sessions to probably test 1887 support or the Trend Average". Support and the TA were tested as expected and the strong reversal signals the beginning of another impulse towards the 2000 level. There is still the possibility of another leg down to support levels again but the counter rally was strong today and a break of 1947 would confirm the correction is over.

On a side note, it looks like Trump will be the Republican nominee. If someone would have predicted this a few years ago, I would have had a good laugh. And to be clear, a Trump presidency would be awesome for my income as I would pay a lot let taxes but not sure about having this man running the country. The GOP is officially a disaster.

For further analysis on the NASDAQ, DJI, RUT, Gold, Silver and Oil please visit http://www.ewaveanalytics.com


Short Term Trend = Bullish
Medium Term Trend = Bearish
Long Term Trend = Bearish


* Trends are not trade signals. Trends are posted for situational awareness only and does not take into account wave counts, technical or fundamental conditions of the market. While mechanically trading the posted trends is feasible, keep in mind that these are lagging indicators and as such are prone to whipsaws and I personally do not use nor recommend them to initiate or close positions in the market without taking into consideration other factors.

Tuesday, February 23, 2016

Elliott Wave Stock Market Update - February 23


The market has continued to follow the count posted and I am looking to a Trend Average test in the next few sessions. A test of support would create a good long opportunity with a short stop, so I might be going long sometime this week.

For further analysis on the NASDAQ, DJI, RUT, Gold, Silver and Oil please visit http://www.ewaveanalytics.com


Short Term Trend = Bullish
Medium Term Trend = Bearish
Long Term Trend = Bearish


* Trends are not trade signals. Trends are posted for situational awareness only and does not take into account wave counts, technical or fundamental conditions of the market. While mechanically trading the posted trends is feasible, keep in mind that these are lagging indicators and as such are prone to whipsaws and I personally do not use nor recommend them to initiate or close positions in the market without taking into consideration other factors.

Monday, February 22, 2016

Elliott Wave Stock Market Update - February 22


As expected the market has rallied to the 1947-50 DMA level in what seems like a 5th wave. In order for bullish momentum to continue, prices need to break out of this resistance area. If the count posted is correct, we will see a correction of the entire rally in the next few sessions to probably test 1887 support or the Trend Average. If the correction is able to turn the TA negative, then bears still have some energy left and could surprise to the downside.

For further analysis on the NASDAQ, DJI, RUT, Gold, Silver and Oil please visit http://www.ewaveanalytics.com


Short Term Trend = Bullish
Medium Term Trend = Bearish
Long Term Trend = Bearish


* Trends are not trade signals. Trends are posted for situational awareness only and does not take into account wave counts, technical or fundamental conditions of the market. While mechanically trading the posted trends is feasible, keep in mind that these are lagging indicators and as such are prone to whipsaws and I personally do not use nor recommend them to initiate or close positions in the market without taking into consideration other factors.

Friday, February 19, 2016

Elliott Wave Stock Market Update - February 19


The market has continued to consolidate gains and should start to rally early next week as long as today's low of 1902 doesn't get breached. Oil's sell off did not help but assuming major producers can agree to some sort of freeze or even cut in production, oil prices will stabilize going forward. Demand for oil is strong (8 year high), producers just need to eliminate that extra million barrel a day flooding the market.

Also, I was looking at tax plans being proposed by candidates and wanted to post the following link. As much as I think Trump is a clown, he has the best tax plan and one that would save me a lot of money. The worst thing that could happen to this country would be a Sander's presidency given his communist tax plan. If Sander's were to win, there will be a major stock market collapse for sure. 

http://taxfoundation.org/comparing-2016-presidential-tax-reform-proposals

Have a great weekend!

For further analysis on the NASDAQ, DJI, RUT, Gold, Silver and Oil please visit http://www.ewaveanalytics.com


Short Term Trend = Bullish
Medium Term Trend = Bearish
Long Term Trend = Bearish


* Trends are not trade signals. Trends are posted for situational awareness only and does not take into account wave counts, technical or fundamental conditions of the market. While mechanically trading the posted trends is feasible, keep in mind that these are lagging indicators and as such are prone to whipsaws and I personally do not use nor recommend them to initiate or close positions in the market without taking into consideration other factors.

Thursday, February 18, 2016

Elliott Wave Stock Market Update - February 18


The market consolidated some of its recent gains in what seems like a W4 and might attempt to rally as soon as tomorrow to challenge the 1947-1957 area. As long as oil remains stable, we might see the market trade in the 2000 level in the next few weeks.

For further analysis on the NASDAQ, DJI, RUT, Gold, Silver and Oil please visit http://www.ewaveanalytics.com


Short Term Trend = Bullish
Medium Term Trend = Bearish
Long Term Trend = Bearish


* Trends are not trade signals. Trends are posted for situational awareness only and does not take into account wave counts, technical or fundamental conditions of the market. While mechanically trading the posted trends is feasible, keep in mind that these are lagging indicators and as such are prone to whipsaws and I personally do not use nor recommend them to initiate or close positions in the market without taking into consideration other factors.

Wednesday, February 17, 2016

Elliott Wave Stock Market Update - February 17


The market has continued to rally as expected and we might see the 50 DMA (currently at 1960) tested without much of a retrace in the next few days.  Sometimes, market reversals become what I call "stand alone W3s" and this bullish wave might evolve into one. The next resistance level is 1947-1960 and if these levels don't hold the rally, we could see a short squeeze that will send the market towards 2000.

For further analysis on the NASDAQ, DJI, RUT, Gold, Silver and Oil please visit http://www.ewaveanalytics.com


Short Term Trend = Bullish
Medium Term Trend = Bearish
Long Term Trend = Bearish


* Trends are not trade signals. Trends are posted for situational awareness only and does not take into account wave counts, technical or fundamental conditions of the market. While mechanically trading the posted trends is feasible, keep in mind that these are lagging indicators and as such are prone to whipsaws and I personally do not use nor recommend them to initiate or close positions in the market without taking into consideration other factors.

Tuesday, February 16, 2016

Elliott Wave Stock Market Update - February 16


As stated last week prior to the sell off "The less bearish wave pattern would have this wave bottom in the 1812-1820 area". Today's break of 1881 resistance confirms the bottom at 1810 and we could see sustained upside to the 50 DMA currently at 1963. While it is too soon to call for a change of the long term trend, the bottom at 1810 lines up almost perfectly with my prediction of the LT W4 bottoming at 1820. Stable oil prices and a shift in sentiment in markets around the world will help the market move towards the 2000 level again.

For further analysis on the NASDAQ, DJI, RUT, Gold, Silver and Oil please visit http://www.ewaveanalytics.com


Short Term Trend = Bearish
Medium Term Trend = Bearish
Long Term Trend = Bearish


* Trends are not trade signals. Trends are posted for situational awareness only and does not take into account wave counts, technical or fundamental conditions of the market. While mechanically trading the posted trends is feasible, keep in mind that these are lagging indicators and as such are prone to whipsaws and I personally do not use nor recommend them to initiate or close positions in the market without taking into consideration other factors.

Friday, February 12, 2016

Elliott Wave Stock Market Update - February 12


As stated yesterday "There was a substantial bounce from the 1810 low today that could evolve into a full rally as long as 1810 doesn't get breached".  The market has followed through on its counter-rally and the big test will be the 1881 level. If the rally gets past this resistance level, the most bearish scenario will be eliminated and will open the doors to a more sustainable rally. The question then be  if the the LT W5 has started. I haven't updated the Long Term chart (same count for the last 5 years) since August last year and the labels posted on them were from then as I have no touched it since. Notice based on my calculation the price and time for LT W4 and where the market is today. I'll let the chart speak for itself.


Have a great weekend!

For further analysis on the NASDAQ, DJI, RUT, Gold, Silver and Oil please visit http://www.ewaveanalytics.com


Short Term Trend = Bearish trend being challenged
Medium Term Trend = Bearish
Long Term Trend = Bearish

Thursday, February 11, 2016

Elliott Wave Stock Market Update - February 11


The market resumed selling today as expected and the 1812-1820 area I've been mentioning was challenged. There was a substantial bounce from the 1810 low today that could evolve into a full rally as long as 1810 doesn't get breached. Alternatively, if the more bearish option is in play, a rally that falls short of making 1881.60 would set up for the market for a strong sell off to the 1700's.

For further analysis on the NASDAQ, DJI, RUT, Gold, Silver and Oil please visit http://www.ewaveanalytics.com


Short Term Trend = Bearish
Medium Term Trend = Bearish
Long Term Trend = Bearish


* Trends are not trade signals. Trends are posted for situational awareness only and does not take into account wave counts, technical or fundamental conditions of the market. While mechanically trading the posted trends is feasible, keep in mind that these are lagging indicators and as such are prone to whipsaws and I personally do not use nor recommend them to initiate or close positions in the market without taking into consideration other factors.


Wednesday, February 10, 2016

Elliott Wave Stock Market Update - February 10


The bearish 5 wave count was invalidated with today's higher high at 1882. However, selling is likely to resume tomorrow and the main question is whether 1828 will hold. The 'less bearish" wave pattern would have this wave bottom in the 1812-1820 area. But if this is a nested bearish 1-2 set up, then this is headed to 1737. I might go long to play the bounce to the TA at these support levels.

On the political front, the race for the nomination should start getting interesting from now on. It is still hard for me to think that Trump can win the presidency, much less the GOP nomination. But I guess you just can't underestimate Trump's ability to sell himself to the politically disillusioned crowd. In a way, I'd like to see Trump win to see how is he going to build a wall or "make America great again". I smell his BS all the way from this coast :) On the democratic side, they're both bad jokes. I'm actually baffled by the candidate choices on this electoral cycle. I guess the next presidency will fit well with the end of 5 waves from 2009 and a sustained correction and eventual recession.

For further analysis on the NASDAQ, DJI, RUT, Gold, Silver and Oil please visit http://www.ewaveanalytics.com


Short Term Trend = Bearish
Medium Term Trend = Bearish
Long Term Trend = Bearish


* Trends are not trade signals. Trends are posted for situational awareness only and does not take into account wave counts, technical or fundamental conditions of the market. While mechanically trading the posted trends is feasible, keep in mind that these are lagging indicators and as such are prone to whipsaws and I personally do not use nor recommend them to initiate or close positions in the market without taking into consideration other factors.

Tuesday, February 9, 2016

Elliott Wave Stock Market Update - February 9


The bounce made a higher high today and was just a few points shorts of invalidating the potential bearish 5 wave count. But as long as 1872 doesn't get breached, there is a good chance of a lower low coming in the next session or two. Oil was down as much as 8% today and this could be used as an excuse for the markets to sell off. The bias continues to the downside.

For further analysis on the NASDAQ, DJI, RUT, Gold, Silver and Oil please visit http://www.ewaveanalytics.com


Short Term Trend = Bearish
Medium Term Trend = Bearish
Long Term Trend = Bearish


* Trends are not trade signals. Trends are posted for situational awareness only and does not take into account wave counts, technical or fundamental conditions of the market. While mechanically trading the posted trends is feasible, keep in mind that these are lagging indicators and as such are prone to whipsaws and I personally do not use nor recommend them to initiate or close positions in the market without taking into consideration other factors.

Monday, February 8, 2016

Elliott Wave Stock Market Update - February 8


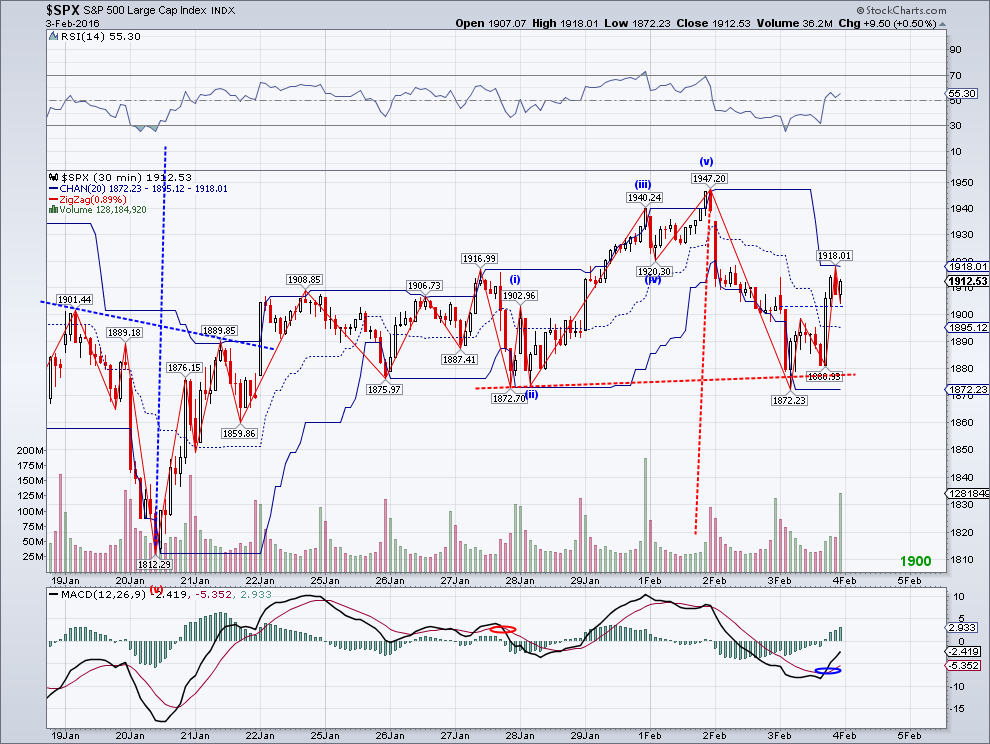
As stated last week "Given how this support level has been tested 4 times, any break could lead to a decisive move down.". The market was not able to hold above the 1872 neckline of the H&S and selling accelerated as expected. The market did manage to make a relative strong bounce but as long as 1872 doesn't get breached, there is a good chance of another sell off to another lower low. There is good support at 1812-1820 but if this level breaks, then we have the 1797 H&S target and ultimately significant support at 1737. Sentiment is obviously bearish but as I said on Friday, the economy is not. So we could see a strong turn around once extreme bearishness is reached.

Anyway, the stock market being bearish is not really big news as anyone on this blog should know the market has been on a downtrend for few weeks. What is news (at least to me) is the outcome of the Republican race for the nomination. After watching last week's debate, I've decided I will vote for Gov Christie or John Kasich if they end up winning the nomination. It's a long shot that either one will be able to beat the Donald or the ultra right-winger but I feel these two candidates are the most competent ones. Donald was surprisingly good at the last debate but it is still Trump! Cruz seems dishonest, on top of his ultra-right views. Carson is not winning and neither is Bush. And Rubio, the one that seemed like was going to get the establishment vote has turned out to be a robot. I don't think I've ever seen a presidential candidate do that bad in a debate. It's almost as if Rubio (despite his large ears) couldn't hear what Christie was saying, he kept repeating himself over and over on Obama and saying the same lines programmed into his brain over and over by his handlers. This is a must watch:

http://www.nj.com/politics/index.ssf/2016/02/christie_assails_rubio_on_the_debate_stage.html

For further analysis on the NASDAQ, DJI, RUT, Gold, Silver and Oil please visit http://www.ewaveanalytics.com


Short Term Trend = Bearish
Medium Term Trend = Bearish
Long Term Trend = Bearish


* Trends are not trade signals. Trends are posted for situational awareness only and does not take into account wave counts, technical or fundamental conditions of the market. While mechanically trading the posted trends is feasible, keep in mind that these are lagging indicators and as such are prone to whipsaws and I personally do not use nor recommend them to initiate or close positions in the market without taking into consideration other factors.


Friday, February 5, 2016

Elliott Wave Stock Market Update - February 5


The market has followed through on its bearish pattern so far by reversing all the recent gains and testing the 1872 level again. Given how this support level has been tested 4 times, any break could lead to a decisive move down. At the same time, if buyers can keep 1872 from breaking then we'll see another rally attempt next week. After all, economic conditions are fairly positive and this helps profits. The unemployment report came in at under 5%, a first since 2008. Most importantly, wages are increasing while gas prices are at the lowest in years which is ideal for a service oriented economy like ours. So while the stock market might continue to correct, the economy is doing well and that's what really matters in the long term. Same goes for the other "concern" on the Chinese economy. They're actually doing well as they are now officially a service oriented economy, the first time in its modern history but not many in the media have paid attention as they continue to focus on manufacturing numbers instead of services. Maybe markets will start reflecting their economies once bears run out of momentum.

Have a great weekend!

For further analysis on the NASDAQ, DJI, RUT, Gold, Silver and Oil please visit http://www.ewaveanalytics.com


Short Term Trend = Bullish
Medium Term Trend = Bearish
Long Term Trend = Bearish


* Trends are not trade signals. Trends are posted for situational awareness only and does not take into account wave counts, technical or fundamental conditions of the market. While mechanically trading the posted trends is feasible, keep in mind that these are lagging indicators and as such are prone to whipsaws and I personally do not use nor recommend them to initiate or close positions in the market without taking into consideration other factors.

Thursday, February 4, 2016

Elliott Wave Stock Market Update - February 4


The market made a higher high today but bullish momentum seems to be waning and we could see selling resume as soon as tomorrow. As long as the "Head" of the H&S at 1947 stays in place, the risk is to the downside. Perhaps the coming jobs report will be used as a catalyst to move the market out of range.

For further analysis on the NASDAQ, DJI, RUT, Gold, Silver and Oil please visit http://www.ewaveanalytics.com


Short Term Trend = Bullish
Medium Term Trend = Bearish
Long Term Trend = Bearish


* Trends are not trade signals. Trends are posted for situational awareness only and does not take into account wave counts, technical or fundamental conditions of the market. While mechanically trading the posted trends is feasible, keep in mind that these are lagging indicators and as such are prone to whipsaws and I personally do not use nor recommend them to initiate or close positions in the market without taking into consideration other factors.

Wednesday, February 3, 2016

Elliott Wave Stock Market Update - February 3


The market bounced right off the 1872 support I mentioned yesterday and ended up closing the day comfortably above the Trend Average. However, the 1872.23 low today eliminates the possibility of an impulse count that had originated at 1872.70 a few days ago. So while on the surface the market appears bullish, the pattern is biased towards the bearish side. There is a head and shoulder's in place that targets 1797 and the only way we would see this pattern reversed is if the rally continues and breaks resistance at 1947.20. Seems like bulls haven't made up their minds yet.

For further analysis on the NASDAQ, DJI, RUT, Gold, Silver and Oil please visit http://www.ewaveanalytics.com


Short Term Trend = Bullish
Medium Term Trend = Bearish
Long Term Trend = Bearish


* Trends are not trade signals. Trends are posted for situational awareness only and does not take into account wave counts, technical or fundamental conditions of the market. While mechanically trading the posted trends is feasible, keep in mind that these are lagging indicators and as such are prone to whipsaws and I personally do not use nor recommend them to initiate or close positions in the market without taking into consideration other factors.